This article will explain everything Australian fisherman need to know about weather including how
forecasts are made, why some forecasts are better than others and important weather concepts.
Along the way we will bust common myths associated with weather and allow Australian fishermen to be
fully informed.
What is ‘The Weather’
When people talk about ‘the weather’ they are generally talking about two things – Observations and
Forecasts.
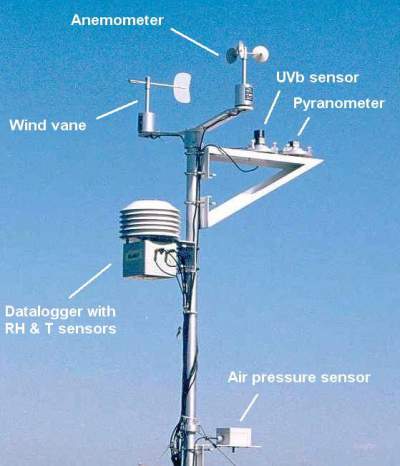
Observations are measurements of weather taken by weather stations. In Australia there are currently 870
weather stations throughout the country.
These stations are fitted with instruments that enable them to measure wind, rain, temperature and
humidity.
They are managed by the Bureau of Meteorology (BoM) and provide a network of current conditions around
the country.
Some stations record all weather variables while others record only some. Similarly, some stations
record values every 10 minutes while others 30 minutes and some only once or twice a day.
BoM make data from these stations readily available so when weather sites report on current conditions
or when the news reports maximum and minimum temperatures recorded for the day they are using data from
these stations.
To see where these weather stations are located throughout the country you can look at the following
links for each state.
Forecasts are predictions of weather in future. They are made by computers that run mathematical models
which simulate changing conditions over time.
Data from these models is used to drive tables, charts and weather maps, or can be summarised into text
forecasts which provide an overview of expected weather conditions for a region.
How Are Forecasts Made?
In order for a forecast model to predict weather ahead it first needs to know what the weather is now.
Weather data from observation stations and other sources is collected and fed into the model as ‘initial
conditions’. These effectively provide a snapshot of what the atmosphere looks like at the current point
in time. The weather model then works out how
weather will evolve over time.
What is a forecast grid?
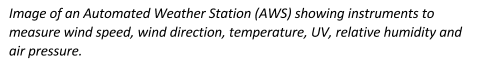
Imagine a series of dots laid out in a grid across Australia. Forecast models use laws of thermodynamics
and other laws to calculate how weather at one point will interact with weather at the next point and by
repeating this process over and over they can
work out what the weather will be at each point in the grid.
Once they get to the end they go back to the start and do it again for the next time step and so on until
there is a forecast for each point in the grid and for every time step. The sum of time steps is the
duration for which the forecast is valid, ie a 7
day forecast. Time steps are usually made in 1 hour or 3 hour intervals with the smaller interval being
better as it provides more data. At each iteration, the model uses expected values it just calculated as
initial conditions for the next time step so it’s easy to se
e how small deviations in expected values at the start of the models run manifest into larger deviations
at the end of the forecast period.
For this reason, forecasts are most accurate close to the present time and less accurate the further
they move away from the present time.
Forecast data files are often called ‘grid files’ because they contain a weather forecast for each point
in the grid for the defined region.
What is Forecast Resolution?
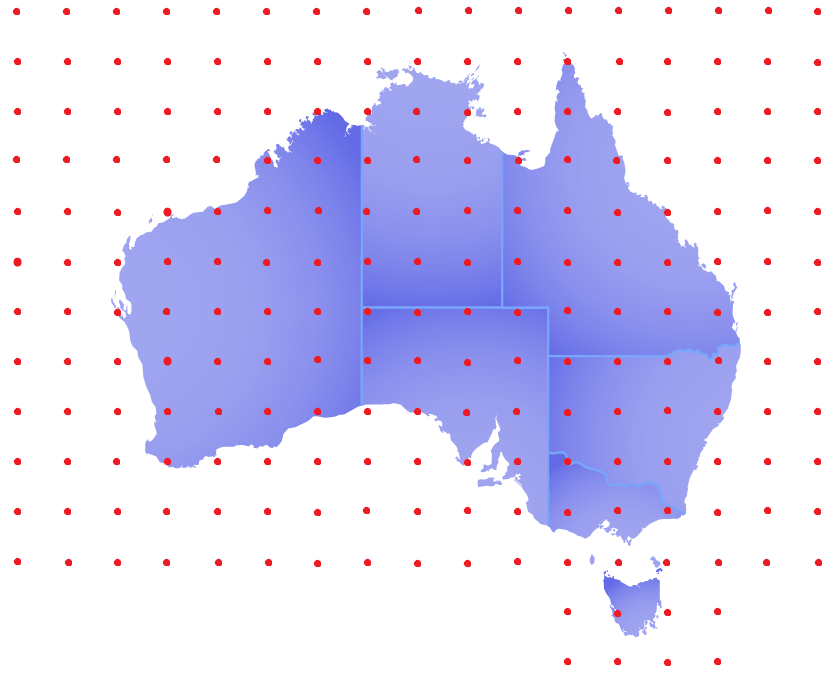
This is an important one so take note. The ‘Resolution’ of a forecast refers to the spacing between dots
in the forecast grid. The smaller the spacing, the closer the points are together and the higher the
forecast resolution. Higher resolution forecasts
are better guesses at what the weather will be than lower resolution models. These days high resolution
generally means grids with less than 10km spacing between points.
You can think about this like a television set. Old box style televisions had fewer dots per area than
modern high definition televisions which pack many more dots into the same space. Just like more dots
make for a clearer picture in television, more dots also make for a better forecast in weather
prediction.
In the below images, the image on the left shows a forecast grid overlaid on Australia. The image on the
right shows a forecast grid overlaid on Australia where the dots are twice as close together, resulting
in a forecast with twice the resolution.
In general, the best forecast model is one that has the highest resolution and the smallest time step
because it contains the most amount of data for a given area.
Even modern super computers are challenged to process the quantities of data required for weather
forecasting hence the need for trade-offs between resolution, size of area being forecast and time
step.
What is a Global Forecast Model and what is a Regional Forecast model?
Since weather is a global phenomenon you can’t isolate a region like Australia and try to forecast
weather there without first understanding what weather is doing in the rest of the world.
All forecast models start by predicting weather across the entire globe first. Global models are run at
relatively low resolutions and these then provide a starting point to run a regional model. Once the
global forecast is complete, meteorologists tell
the computer to focus on a region such as Australia and increase the resolution. This then allows the
computer to refine the global forecast to a high resolution and more precise forecast for the target
region.
If computers were much more powerful then we could run global forecast models at 10 meter resolution and
that would be the end of it, we would have accurate weather predictions for every spot on earth in one
go. The reality is that computers are not yet that powerful so we have to compromise.
What happens after a forecast model is created?
Despite the best forecast models and powerful computers that run them, what comes out is essentially a
computer-guess of what the weather will be. Refining this to a better guess is only achieved when
meteorologists with experience of local weather systems
review and make adjustments to the data which results in a ‘quality controlled’ forecast. You can look
at this process as follows; the global forecast is a first guess, the regional forecast a second guess
and the manual adjustment a third and best guess. The Australian Bureau of Meteorology do this for
Australian forecast grids, a meteorologist in each state looks at the data then adjusts it based on
their experience with local weather systems.
How Do Weather Sites Process Data?
Data that come from agencies like BOM contains a unique forecast for each point in the grid, ie an
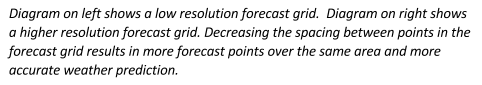
hourly forecast out to 7 days. Imagine you had a wide open space with 4 posts arranged in a square.
If you want a forecast exactly where one of the posts is then it’s a simple case of reading the data
straight out of the file, no calculations are required. If however you want a forecast for another
point in the square that isn’t right on a post then what do you do? You have two options, you can
either select the forecast for the closest post and say that’s close enough, or you can try and
calculate what it would be at the exact location in question. This is where the ‘processing’ aspect of
websites comes in to play.
The red star represents the location where we want a forecast. We can either take the forecast for the nearest grid point or try and work out exactly what it would be where the star is.
If you are using a high resolution forecast grid like ADFD 3km (more on this later) then it doesn’t
matter so much as there is unlikely to be much perceivable difference in weather within a 3km
square. If a site was using lower resolution forecast models with 27, 55 or 70km grids, which were
common just a few years ago, then it is more important. The process of coming up with a forecast
within the square is called ‘interpolation’. The most common method to handle this situation is
simply to look at surrounding grid points and half the difference. Ie if you are in the middle of two
grid points and one says 10 knots and the other says 12 knots then you would say its going to be 11
knots in the middle. If you are closer to the first than the second then it may work out to be 10.5.
Interpolation does get a bit more interesting when a low resolution forecast model is used and you
want a forecast right on the coastline. Soon we will look at sea breezes and see how different
methods can be used to interpolate winds on the coast.
How are text forecasts made?
Text forecasts are verbal summaries of conditions that can be expected for a region. For example:
WINDS:
Northwest to northeasterly 10 to 15 knots tending southeast to southwesterly in the early afternoon then
tending north to northwesterly in the evening.
SWELL:
Southwesterly 1.5 metres, increasing to 1.5 to 2 metres during the morning.
These forecasts are made by meteorologists who look at forecast grids and try to summarise expected
outcomes for a given area for a given day. They provide a convenient way for people to understand a
forecast verbally, for example over the radio or from
one person to another.
The text forecast is for a weather region as defined by the Bureau of Meteorology. One drawback with
these forecasts is that the regions are often large and although there is variation within the region
the text forecast provides an average overall.
Significant variation can often be seen in coastal areas since marine regions extend 60nm (~110km)
offshore whereas most recreational activities are close in to shore. Wind, wave and swell are often
stronger away from land and off the continental shelf so text forecasts will often say wind, wave and
swell are greater than recreational anglers may experience close in to
land.
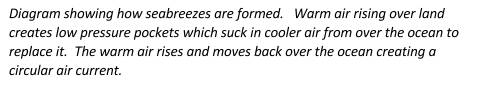
What Is A Seabreeze?
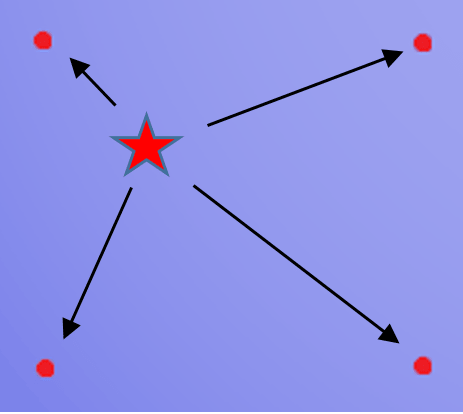
Sea Breezes are caused by the uneven heating of sea and land masses by solar radiation. As the sun rises
in the sky, temperatures on land get hotter but temperatures over water don’t change much. This causes
air to rise over land which sucks in air from over
the ocean and creates an air current. This air current forms a cyclic motion that picks up cool air from
the ocean and brings it inland to replace the rising hot air. Seabreezes are strongest right on the
coast line as this is where the cyclic air currents have maximum
flow.
Given the difference in temperatures increases as the day goes on, seabreezes normally pick up in the
afternoon and continue into the evening until the temperature on land has cooled.
Why do some sites try and predict the seabreeze?
When a low resolution forecast model is used in weather prediction much of the seabreeze air current is
not detectable as the forecast points are too far apart.
To compensate for this, calculations are made to try and guess what the wind would be at the waters
edge. This is often done for users like kite surfers who want to know wind speeds where they surf.
To understand this better, think back to earlier when we described how forecasts are made, now imagine we
are using a forecast model with 27km resolution that has a grid point approx. 13km out to
sea and another 13km inland.
While the model calculates wind speed at these forecast points with some accuracy, since they are far
away from the coast they do not pick up all of the cyclic air flows occurring above the waters edge.
Some sites therefor apply a calculation which attempts to predict what wind strength
would be at that point. Sites that do this typically have few locations registered as they each require
a specific set of calculations exactly tuned to a point spot on the coast.
Overall, this process is a method of interpolating a forecast where forecast grid points straddle a land
/ water boundary.
Seabreeze compensation calculations are largely unnecessary these days as high resolution forecast models
accurately calculate seabreezes natively since grid points are much closer together.
It’s only sites that use low resolution forecast models who continue to use this method. What’s more,
compensation calculations that calculate seabreezes are only intended for a particular spot and away
from that spot they are not valid.
Why is it Important to Use a Weather Site That Provides Forecasts Over Open Water?
Wind blows faster over the ocean than over land because there is less surface friction. Land has
mountains, coastal barriers, trees, human made structures, and sediments that cause a resistance to
the wind flow. Oceans do not have these impediments therefor wind can blow at a greater velocity.
When wind blows parallel to the shoreline this effect is most noticeable as the wind has had a longer
time to pick up speed (over water) or slow down (over land).
For this reason it’s important to check wind forecasts over open water where you intend to travel as
models take into consideration surface resistance when estimating wind speed. Even being a small
distance out from shore can experience significantly different wind speeds.
Wind travels faster over water than over land because there is reduced surface friction. When wind blows parallel to the shoreline there can be significant differences in wind speed only a short distance from the shoreline.
Over the years fishermen have become accustomed to checking weather forecasts at the town in
which they launch their boat rather than over the area they intend to fish. Due to the surface
friction effect this is not a good approach. The further offshore a fishermen is intending to travel the
greater the potential wind speed difference becomes and this is the reason many fishermen have
been caught out despite thinking they did the right thing by checking the weather before they left.
A weather site that provides forecasts over open water should always be used over a weather site
that provides land based forecasts if the user is intending to venture out from shore.
As the angle of wind changes and wind starts blowing more perpendicular to the shoreline the
difference between velocity of wind over water and land begins to equalise. For winds that are
directly on or offshore there is not much difference between land speeds and water speeds.
Busting the Myths
Myth – Overseas agencies produce forecast data for Australia as well as the BoM.
Verdict - True. There are essentially 3 agencies that produce forecast data that covers Australia. These
are:
Bureau of Meteorology (BoM) in Australia
National Oceanic & Atmospheric Administration (NOAA) in USA
European Center for Medium Range Weather Forecasts (ECMWF) in UK.
While there are some other agencies that produce data that covers Australia it is generally not
accessible and not commonly used by weather sites.
Myth – All weather sites get their data from BoM.
Verdict - False. BoM forecast data is relatively expensive so most sites don't use it. While all weather
sites use BoM’s network of weather stations to get current conditions(observations) they do not all get their forecast
data from BoM. Most weather sites do
not use BoM forecast data because it only covers Australia, instead most sites and apps use forecast data from the NOAA in America. The NOAA
produce a global forecast model called GFS which is available on the internet.
This data is free and provides global coverage hence it offers an attractive data source to weather
sites since they can operate a single forecast model at low cost and service the entire globe which
broadens their market.
Fish Ranger provides users with both BOM and GFS wind forecasts so users can get a consensus rather than relying on only 1.
Myth – Weather sites take data from BoM then improve it with algorithms and
formulas. That’s why some have better forecasts than others.
Verdict - False. It is not possible to improve a weather forecast by simply applying an equation,
algorithm or formula. If it was then that equation would have been applied at the time the model was
created.
Models are nothing more than the output of a series of complex calculations so adding another
calculation at the end to ‘make it more accurate’ would be easy to do if it was possible.
Although there are different forecast models available, each have a slightly different purpose, are open
source, and have been optimised by meteorologists over many years.
Differences observed in weather site forecasts are because different sites use different forecast models
as inputs, they display data differently or, most commonly, because the forecast is not at the same
point as the location shown.
This can be because the site utilises a ‘nearest neighbour’ selection method to select a forecast from a
grid or a pre-defined list rather than having an independent forecast at every location.
This essentially means when people are comparing forecasts on different sites they are not really
comparing the same location, hence there can be large differences.
BoM’s MetEye tool for example picks the closest point from a 6km grid. Some other sites that use the
GFS27 model pick the closest point a 27km grid, so the actual forecast provided by websites is often not
where users think it is. This has most impact along the coast where wind speed drops off significantly
over land. Fish Ranger uses a high resolution grid
and interpolates forecasts from surrounding grid points to prevent this problem occurring.
Myth – Global forecast models are better because they take the whole world
into consideration.
Verdict – False. Global forecast models are only produced to provide a starting point to run regional
forecast models and to fill gaps between continents. Each of the countries that produce global models do
not use them for weather forecasting in their own
country! Did you get that? I’ll repeat it because it’s important each of the countries that produce
global models do not use them for weather forecasting in their own country.
They instead use higher resolution regional models which are derived from the global. NOAA who produce
the global GFS model at 9km then refine it to get the NAM (North American Mesoscale) model which covers
just north America at 4km resolution. This is what the USA use for weather forecasting in their own
country. Similarly, BoM produce a global model
called ACCESS-G at 12km then refine it to get the ADFD which only covers Australia but has a resolution
of 3km or 6km (state dependent) and is more accurate than ACCESS-G.
Its not to say that global models are inaccurate, certainly over the years their accuracy has improved
significantly with increased computing power, but in general a locally refined regional model is a
better forecast.
Myth –BoM website must be the most accurate because they make the data
Verdict – False. As a government agency all data produced by BoM is available to registered users; they
do not keep the best for themselves. For a fee users can access the data and use it any way required. In
actual fact, users of Fish Ranger in Victoria and Tasmania get better forecast data than BoM provide on
their own site. This is because Fish Ranger
uses individual state grid files rather than the national grid which is used to drive MetEye.
The state files for VIC and TAS have 3km resolution whereas the national file has a uniform 6km across
all states. Fish Ranger’s VIC and TAS users will therefor get more detailed forecasts than by using
MetEye (In other states the data sets are equal). Th
e difference between a 3km grid and 6km grid is a 4 fold increase in data due to their being 4 x as many
grid points covering the same area. To see the forecast as the meteorologist who created it intended,
you need to be using Fish Ranger and not MetEye.
At Fish Ranger’s insistence, at Jan 2017, BoM updated documentation to confirm this fact since it was
previously only known to some behind the scenes people and therefor doubted by the public. You can
confirm this here:
Myth – BoM forecast the wind at 3 hourly intervals, weather sites then take
that data and try to forecast the hours in between.
Verdict - False. The BoM’s ADFD dataset provides hourly wind data out to 7 days. BoM’s MetEye tool which
displays ADFD data only shows forecasts at 3 hour time steps despite the underlying data containing 1
hour time steps. Fish Ranger shows every hour as the model predicts allowing users to better see
approaching changes.
In addition Fish Ranger use another BOM forecast model to provide forecasts between 8 and 10 days,
providing a full 0 to 10 day forecast range.
Myth - All weather sites get their data from BoM so you are better off
going to BoM.
Verdict - False. The BOM website is a mish mash of different tools and sections that each display their
own thing. It is not consolidated on a single page, it doesn’t show variables of interest to fishermen
like air pressure, nor dies it do things like overlay live readings on the forecast so you can see how
it is tracking. It’s also not available as an app, trying to use its tools on a mobile is difficult. The
BOM can’t be in competition with private companies so while they provide quality data, they take a back
seat with showcasing that data on their own site and leave it to weather apps that do a better job of
consolidating and displaying it.
Myth – Averaging out all the weather sites will give me a better idea what
the weather will be than just sticking to one.
Verdict - False. Averaging weather sites that use low quality data just results in a lower confidence
forecast. More weight should be given to sites that use better forecast models. Imagine you wanted to
know how to catch a swordfish and so wanted some adv
ice on doing so. Now imagine you bumped into a group of 5 people at the pub one of who happens to be a
champion game boat skipper and the other 4 weekend warriors on the snapper. Would you take advice from
all 5 people and average it out or would you listen to the game
boat skipper and weight his advice above others? You would listen to the game boat skipper as he is the
best source of information. It’s a similar situation with weather sites.
Myth – Weather forecasts are only made where there is a weather
station
Verdict – False. While observations can only be made where there is a weather station forecasts can be
made anywhere. Forecast grids cover the entire country and a set distance out to sea. By looking at data
from the 4 surrounding grid points forecasts can be made for any location required, on land or sea.
Myth – If a weather site gets the weather wrong it can’t be accurate and
you should use another moving forward.
Verdict - False. Every weather model is going to get the weather wrong it’s a question of how much and
how often, you need to pick the one that’s right more often and stick to it. Think of this like an
amateur poker player coming up against a professional
poker player. Over the course of a couple of hands the amateur player may get lucky and come out on top.
If however they play for many hours the professional player will end up winning because they are a
better player. Similarly, the best forecast models will get it
wrong occasionally but they will get it right more often than poorer performing models so back the
better model and stick to it.
Myth – Satellites forecast the weather
Verdict - False. Satellites are used to measure current conditions such as sea surface temperature but
they are not used to forecast the weather. The temperatures measured by satellite are fed into forecast
models as initial conditions but they play no
further role.
What Forecast Models Cover Australia?
There are 6 commonly used forecast models that cover Australia. Four of these are for general weather and
two are for wave and swell.
Produced by BoM
ADFD –
ADFD stands for ‘Australian Digital Forecast Database’ and is BoM’s official and best forecast
data for Australia. It provides forecasts for weather, wave and swell. The ADFD has a resolution of 3km
in VIC and TAS and 6km in other states making i
t the highest resolution forecast data available for Australia anywhere in the world. ADFD is quality
controlled which means meteorologists in each state review the computer output and make manual
adjustments based on experience with their local weather systems. The wave
and swell forecasts are provided out to 60nm (approx 110km) from shore. ADFD is the BEST forecast data
for Australia.
There are three common global models that cover Australia, these are GFS, IFS and Wavewatch III.
GFS -
Global Forecast System (GFS) is a forecast model produced by the National Oceanic and Atmospheric
Administration (NOAA) of America. It is a global model which covers every part of the Earth and is the
most commonly used weather model by weather sit
es all over the world. It is available for free on the internet and is not edited by meteorologists
before being released. As computing power has increased, upgrades have enabled NOAA to increase
resolution of the GFS model. There are currently three versions in operation with resolutions of 27km, 13km and 9km.
The 9km version is better than the others but many weather
sites still use the 27km or 13km version simply because they have not upgraded their systems yet.
IFS -
The Integrated Forecast System (IFS) is a global model produced by the European Center for
Medium-Range Weather Forecasting (ECMWF) in England. IFS is not quality controlled and exists in 3
versions, a 55km, 18km version and a 9km version. Some
variables from the data set are free and others need to be paid for hence it is not used as much as the
GFS model.
Wavewatch III –
This model is produced by the NOAA in America and provides wave and swell data. It covers the
entire globe at a resolution of 50km. It is freely available on the internet.
If you believe any details about this location are incorrect or need updating please let us know. Your feedback is valuable to the Fish Ranger team and other users of the site.
Seeing two winds charts is like getting a second opinion. If there is consensus between the forecast models there is a higher degree of confidence those conditions will prevail.
The BOM and GFS models are independent. They are produced by different agencies and have different model physics so when they arrive at the same conclusion you can be more confident the forecast will be correct.
If the models differ on any given day and one says strong winds while the other says low winds then there is little consensus and therefor lower confidence in an accurate forecast on that day.
The BoM model is the model we have always used and is the model used by Meteye and Willyweather. GFS is the model used by many other weather sites including Windfinder, Buoyweather, Windy, WindGuru and others. In most parts of Australia the BoM model will be more accurate but there some areas where GFS may prove more reliable. Users should observe both over a period of time and determine which performs better at their location.
Technical Information The BoM (ADFD) model has a resolution of 3km in VIC & TAS and 6km in other states, it covers Australia out to a distance of 60nm from shore. The GFS model has a resolution of 9km and covers the entire globe.
Note: In June 2019, thanks to a 10 fold increase in computing power, NOAA who produce the GFS upgraded the model to a high performance FV3 version. This change increased resolution from 13km down to 9km and improved model physics. FV3 is the version used by Fish Ranger.
Wondering why we don't we use the ECMWF 9km model? The BOM model is based on the 'EC' model so they have very similar model physics and are not independent. By showing BOM and GFS models we can present two high quality independent forecasts.
We use bilinear interpolation to provide forecasts true to the chosen location, be they on sea or land.
What is Solunar?
Solunar Theory states that all wildlife have periods of heightened physical activity that correspond with the locations of the sun and the moon. The theory was published by John Alden Knight in 1936 after years of documented and anecdotal research. The name Solunar comes from ‘Sol’ for sun and ‘Lunar’ for moon.
The theory found that aside from tides, the relationship of the moon and sun’s position also affected fishing effectiveness. When the moon is directly overhead or underfoot, rising or setting, fish are more likely to feed than at other times of the day. If one of these periods occurs close to sunrise or sunset then feeding activity is higher again, and if the moon is in a new or full phase then the highest activity of the month can be expected.
Major periods are defined as one hour each side of when the moon is directly overhead or underfoot, minor periods are defined as one hour each side of when the moon is rising or setting. The Solunar Calendar allows fishermen to better predict what days of the month and at what times of the day fish are more likely to be feeding.
Each of the peaks on the Solunar Chart correspond to a moon event - Moon Rise, Moon Set, Moon Above or Moon Below. The heights of the peaks are related to the phase of the moon and the proximity to a sunrise or sunset. According to Solunar Theory, fishing is more likely to be successful at the times of the peaks with higher peaks indicating better fishing.
One experiment that supported the theory was when Dr. Frank A. Brown, a biologist at Northwestern University in USA, had some live oysters flown to his lab near Chicago. Oysters open their shells with each high tide, and Dr. Brown wanted to see if this was due to the change in ocean levels or to a force from the moon itself. He put them in water and removed them from all sunlight. For the first week they continued to open their shells with the high tides from their ocean home. But by the second week, they had adjusted their shell-openings to when the moon was directly overhead or underfoot in Chicago.
Solunar tables need to be used along with common sense. Not every day will there be a clear relationship between fish biting and major or minor periods as other factors are involved which affect a fish’s willingness to feed. Barometric fluctuations, particularly when the trend is down, often make for poor fishing. All wildlife knows what to expect of the weather, and any bird, animal or fish can sense the approach of a storm. Cold fronts moving through drive fish deeper and render them inactive.
Adverse temperature, abnormal water conditions, and other factors all need to be considered as these offset the effects of major and minor periods, but when other factors are constant the Solunar calendar can be a good guide to identify better fishing days and times.
Fish Ranger’s Solunar Calendar is calculated individually for each location and all times are pre-adjusted for daylight savings so you can use the calendar with ease.
What is Dew?
Our Humidity & Dew chart shows two things - the relative level of humidity in the air and the times of day when dew is likely to form.
When relative humidity gets into the green zone at the top of the chart dew is expected to form on exposed surfaces.
Relative humidity tells us how much water vapour is in the air relative to how much vapour the air can support at its given temperature. Hot air can hold more vapour than cold air. When air cools at night, while the actual amount of vapour may not change, given the temperature is lower the air can't hold as much vapour and so the relative humidity goes up. When it hits 100% the air can not hold any more vapour and it becomes saturated. At this point vapour starts condensing out of the air and onto exposed surfaces in the form of small water droplets. These droplets are called dew.
Our chart has the green dew zone starting at about 95% relative humidity. Strictly speaking, dew will not form unless relative humidity hits 100%. Since there are micro climates of colder air in depressions, areas where sun doesn't hit like the cold side of a mountain, or on surfaces sheltered from the wind, their temperature can be lower than average and in these spots dew may form. So if the overall relative humidity is expected to reach around 95% then its likely dew will form in small patches. When it hits 100% dew will form over large areas.
popup-chnge_login_method
Loading...
or
Choose State
Please select the state:
All
NT
QLD
SA
NSW
TAS
VIC
WA
ACT
Location type
Request new LOCATION
1
Choose location
2
Enter Details
3
Review & submit
Request new LOCATION
1
Choose location
2
Enter Details
3
Review & submit
Request new LOCATION
1
Choose location
2
Enter Details
3
Review & submit
MapSatellite
+-
Download the Fish Ranger mobile app for free
Subscribe Now
Loading
Forgot password?
Please enter your email address and we will send you a link to reset your password
Forgot password?
A Link to reset your password was successfully sent to